
Transforming StreetMetrics’s manual media-planning process into a scalable self-service workflow
Transforming StreetMetrics’s manual media-planning process into a scalable self-service workflow
Transforming StreetMetrics’s manual media-planning process into a scalable self-service workflow
StreetMetrics is an OOH (out-of-home) advertising analytics platform that helps media operators plan and measure advertising campaigns. Media planners use StreetMetrics to evaluate advertising opportunities and create media plans
Problem: Creating media plans relied heavily on manual support from the StreetMetrics team
Outcome: Transformed media planning into a self-serve experience, reducing planning time by 92%, from ~2 days to ~2 hours
StreetMetrics is an OOH (out-of-home) advertising analytics platform that helps media operators plan and measure advertising campaigns. Media planners use StreetMetrics to evaluate advertising opportunities and create media plans
Problem: Creating media plans relied heavily on manual support from the StreetMetrics team
Outcome: Transformed media planning into a self-serve experience, reducing planning time by 92%, from ~2 days to ~2 hours
StreetMetrics is an OOH (out-of-home) advertising analytics platform that helps media operators plan and measure advertising campaigns. Media planners use StreetMetrics to evaluate advertising opportunities and create media plans
Problem: Creating media plans relied heavily on manual support from the StreetMetrics team
Outcome: Transformed media planning into a self-serve experience, reducing planning time by 92%, from ~2 days to ~2 hours
Company:
Company:
Role:
Role:
Team:
Team:
Duration:
Duration:
StreetMetrics
StreetMetrics
UX Designer
UX Designer
1 UX Designer, 1 Frontend Engineer, 1 Backend Engineer
1 UX Designer, 1 Frontend Engineer, 1 Backend Engineer
2 months
2 months
2 months
Challenge
Challenge
Creating a media plan was manual and took at least 2 days, this would not scale
Creating a media plan was manual and took at least 2 days, this would not scale
StreetMetrics introduced packages to help clients create media plans more efficiently.
One problem remained. When clients needed to mix and match packages to create a more customized plans, the process still required time-consuming back-and-forth manual collaboration with StreetMetrics.
My project was to digitize this workflow and make it self-service.
StreetMetrics introduced packages to help clients create media plans more efficiently.
One problem remained. When clients needed to mix and match packages to create a more customized plans, the process still required time-consuming back-and-forth manual collaboration with StreetMetrics.
My project was to digitize this workflow and make it self-service.

Requirement gathering
Requirement gathering
I started by partnering with Product, Customer Solutions, and Data to prioritize MVP requirements for customizable plan creation
I started by partnering with Product, Customer Solutions, and Data to prioritize MVP requirements for customizable plan creation
StreetMetric’s users were out-of-home advertising companies and there were two users groups who worked with media plans:
Sales managers — Create preset packages and customize allocations in order to price them for their clients
Media planners — Build media plans by analyzing package performance against campaign goals
To support both workflows, I identified three core MVP requirements:
Visualize key performance metrics
Support flexible allocation customization
Enable side-by-side package comparison
StreetMetric’s users were out-of-home advertising companies and there were two users groups who worked with media plans:
Sales managers — Create preset packages and customize allocations in order to price them for their clients
Media planners — Build media plans by analyzing package performance against campaign goals
To support both workflows, I identified three core MVP requirements:
Visualize key performance metrics
Support flexible allocation customization
Enable side-by-side package comparison

Workflow strategy
Workflow strategy
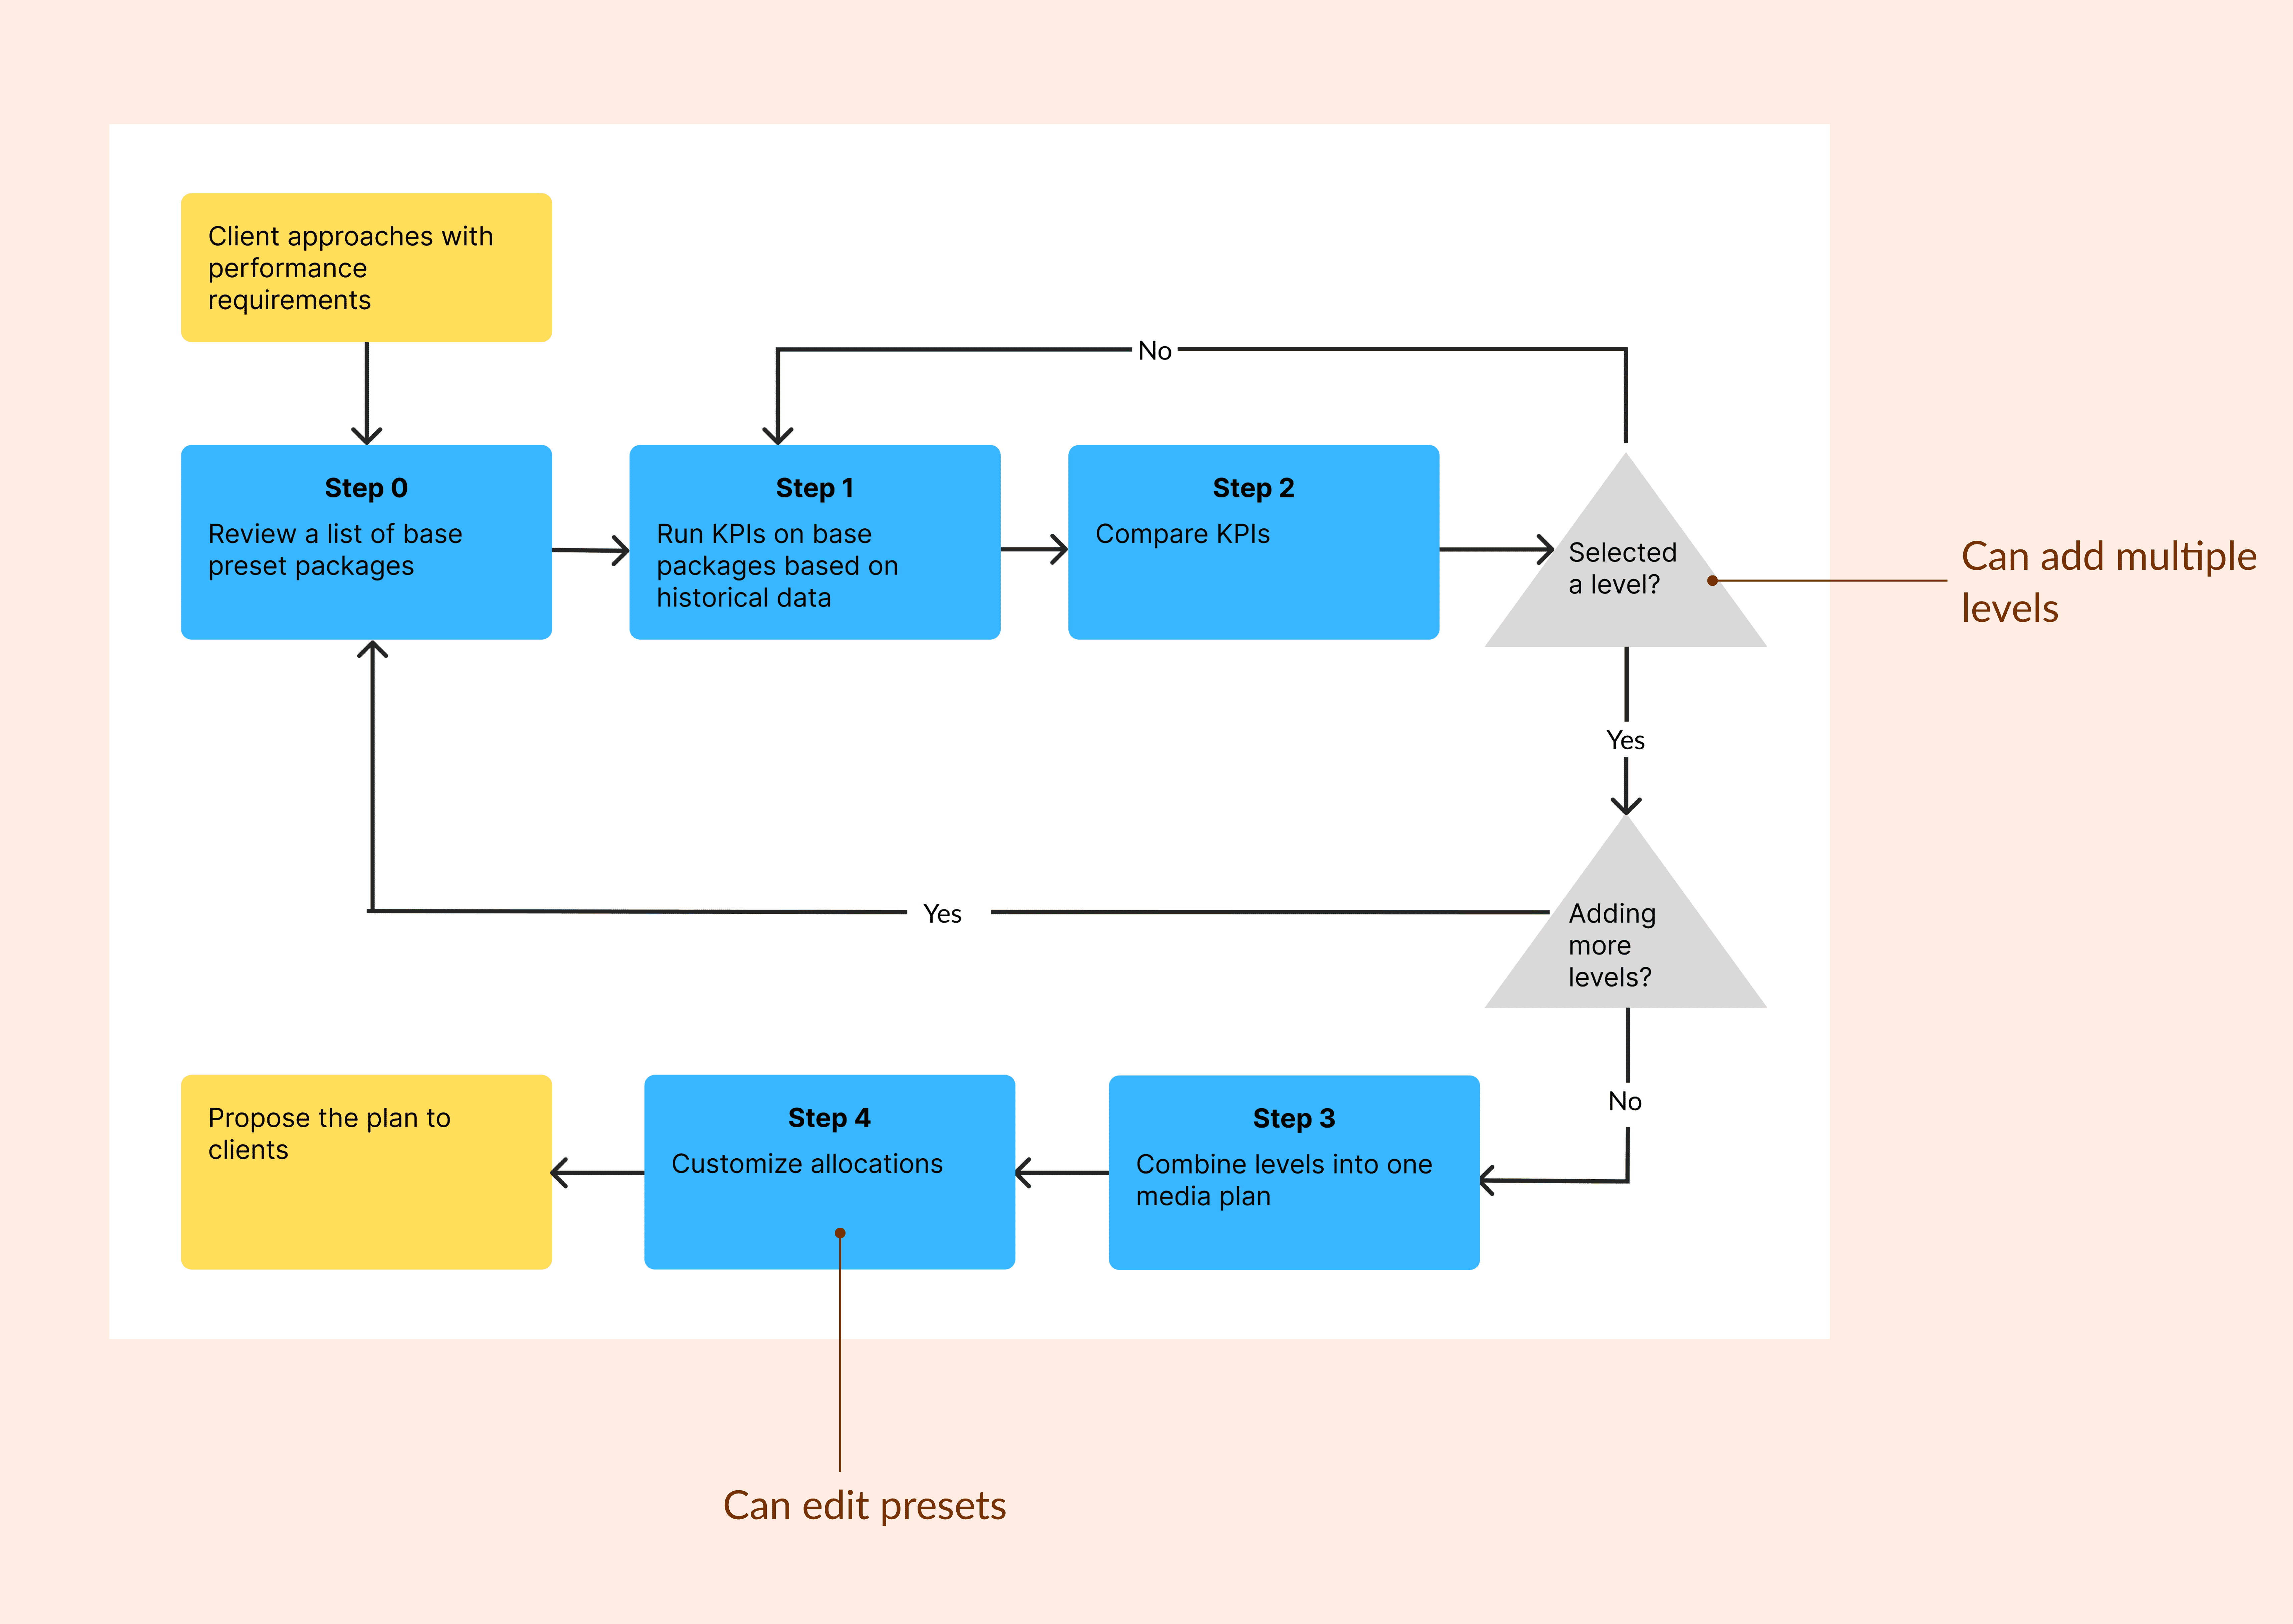
Because media-plan creation required planners to repeatedly evaluate and adjust package combinations, I designed a user flow that supported comparison and refinement before finalization
Because media-plan creation required planners to repeatedly evaluate and adjust package combinations, I designed a user flow that supported comparison and refinement before finalization
Media-plan creation was not a linear process. Planners needed to do the following steps repeatedly until the combination met the campaign’s goals:
Step 0: Media Planner sees a list of media plans in their account and has an option to create a new plan.
Step 1: Media Planner selects a preset package level.
Step 2: Media Planner compares different metrics of preset packages and selects the level they want.
Step 3: Media Planner adds additional levels to the plan.
Step 4: Media Planner customizes the plan.
Media-plan creation was not a linear process. Planners needed to do the following steps repeatedly until the combination met the campaign’s goals:
Step 0: Media Planner sees a list of media plans in their account and has an option to create a new plan.
Step 1: Media Planner selects a preset package level.
Step 2: Media Planner compares different metrics of preset packages and selects the level they want.
Step 3: Media Planner adds additional levels to the plan.
Step 4: Media Planner customizes the plan.
Deciding on information structure
Deciding on information structure
After exploring multiple approaches, I narrowed it down to two workflow patterns to determine which better supported iterative package comparison and selection
After exploring multiple approaches, I narrowed it down to two workflow patterns to determine which better supported iterative package comparison and selection
The concepts supported the same planning tasks but structured the workflow differently: a flexible, card-based workspace versus a guided, sequential wizard.
Concept A: cards
Planners can select which level to display metrics as a graph
Selected levels will be added to a new media plan
Supports scanning, non-linear comparison, and progressive disclosure
Concept B: wizard
Planners start with a filter screen to narrow the preset packages
A graph and table for each package appear after filters are applied
Provides more guidance but restricts comparison to a linear sequence
After experimenting with multiple designs, I narrowed down to two patterns. Concept A won out because it includes a graph that allows for comparisons across multiple packages or levels. Additionally, it clearly highlights the selected packages or levels for the new plan.
Concept A: cards
Information of each package is available in the form of a card
Planners can toggle levels on and off to display metrics as a graph
Toggled-on levels can be added to a new media plan
Concept B: wizard
Planners starts with a filters screen to filter preset packages
Graphs and table for each package visible after applying filters
Pagination
After selecting package levels, customization starts on the next screen
After experimenting with multiple designs, I narrowed down to two patterns. Concept A won out because it includes a graph that allows for comparisons across multiple packages or levels. Additionally, it clearly highlights the selected packages or levels for the new plan.
Concept A: cards
Information of each package is available in the form of a card
Planners can toggle levels on and off to display metrics as a graph
Toggled-on levels can be added to a new media plan
Concept B: wizard
Planners starts with a filters screen to filter preset packages
Graphs and table for each package visible after applying filters
Pagination
After selecting package levels, customization starts on the next screen

Technical Constraint
Technical Constraint
While evaluating both patterns, I identified a server-load constraint and mapped an on-demand computation flow with Engineering, ultimately favoring Concept A’s card pattern
While evaluating both patterns, I identified a server-load constraint and mapped an on-demand computation flow with Engineering, ultimately favoring Concept A’s card pattern
Concept B offered more guidance, but displaying every package's levels and metrics upfront would require the server to run heavy computations, leading to poor performance.
I then worked with Engineering to create a metric computation control flow that computed metrics only on demand, allowing Concept A to preserve iterative comparison without sacrificing performance.
Concept B offered more guidance, but displaying every package's levels and metrics upfront would require the server to run heavy computations, leading to poor performance.
I then worked with Engineering to create a metric computation control flow that computed metrics only on demand, allowing Concept A to preserve iterative comparison without sacrificing performance.

Designing each step of the user flow:
Designing each step of the user flow:
Designing each step of the user flow:
Design “Saved Media Plans” screen
Design “Saved Media Plans” screen
Step 0: Plans dashboard
Step 0: Plans dashboard
Step 0: Plans dashboard
Planners start out at the dashboard. They can easily view all the media plans within their organization.
The planner can view, edit and delete any plan.
Each plan has basic information, such as creation date and last updated date.
Planners start out at the dashboard. They can easily view all the media plans within their organization.
The planner can view, edit and delete any plan.
Each plan has basic information, such as creation date and last updated date.
Planners start out at the dashboard. They can easily view all the media plans within their organization.
The planner can view, edit and delete any plan.
Each plan has basic information, such as creation date and last updated date.

Design (package overviews)
Design (package overviews)
Step 0 (continued): Clear view of all packages from client’s account
Step 0 (continued): Clear view of all packages from client’s account
Step 0 (continued): Clear view of all packages from client’s account
Planners can then start the process of investigating which package works best. When the planner starts creating a new media plan, each card provides a self-contained overview of the package.
Planners decide which levels to view and compare.
Planners can monitor their selected levels through toggle switches
Activated packages become part of the plan, ready to be confirmed.
Planners can then start the process of investigating which package works best. When the planner starts creating a new media plan, each card provides a self-contained overview of the package.
Planners decide which levels to view and compare.
Planners can monitor their selected levels through toggle switches
Activated packages become part of the plan, ready to be confirmed.

Design (reviewing KPIs)
Design (reviewing KPIs)
Step 1: Review historical data
Step 1: Review historical data
Step 1: Review historical data
To determine which plan is best, The planner then runs KPIs (such as impressions) of preset packages.
Metrics calculated in real time and shown on the graph.
Ability to switch between metrics
Package toggle must be on and a level must be selected in order to view graphical data
To determine which plan is best, The planner then runs KPIs (such as impressions) of preset packages.
Metrics calculated in real time and shown on the graph.
Ability to switch between metrics
Package toggle must be on and a level must be selected in order to view graphical data

Design (package comparison)
Design (package comparison)
Step 2: Compare packages
Step 2: Compare packages
Step 2: Compare packages
Once the best plan is determined, the planner uses the graph to compare package KPIs and choose the package that best meets their goal.
Graph presents impression per package level for making comparisons
Multiple packages can be activated through the toggle
The metrics dropdown ensures that all selected packages are compared using the same criteria
Once the best plan is determined, the planner uses the graph to compare package KPIs and choose the package that best meets their goal.
Graph presents impression per package level for making comparisons
Multiple packages can be activated through the toggle
The metrics dropdown ensures that all selected packages are compared using the same criteria

Design (adding more packages)
Design (adding more packages)
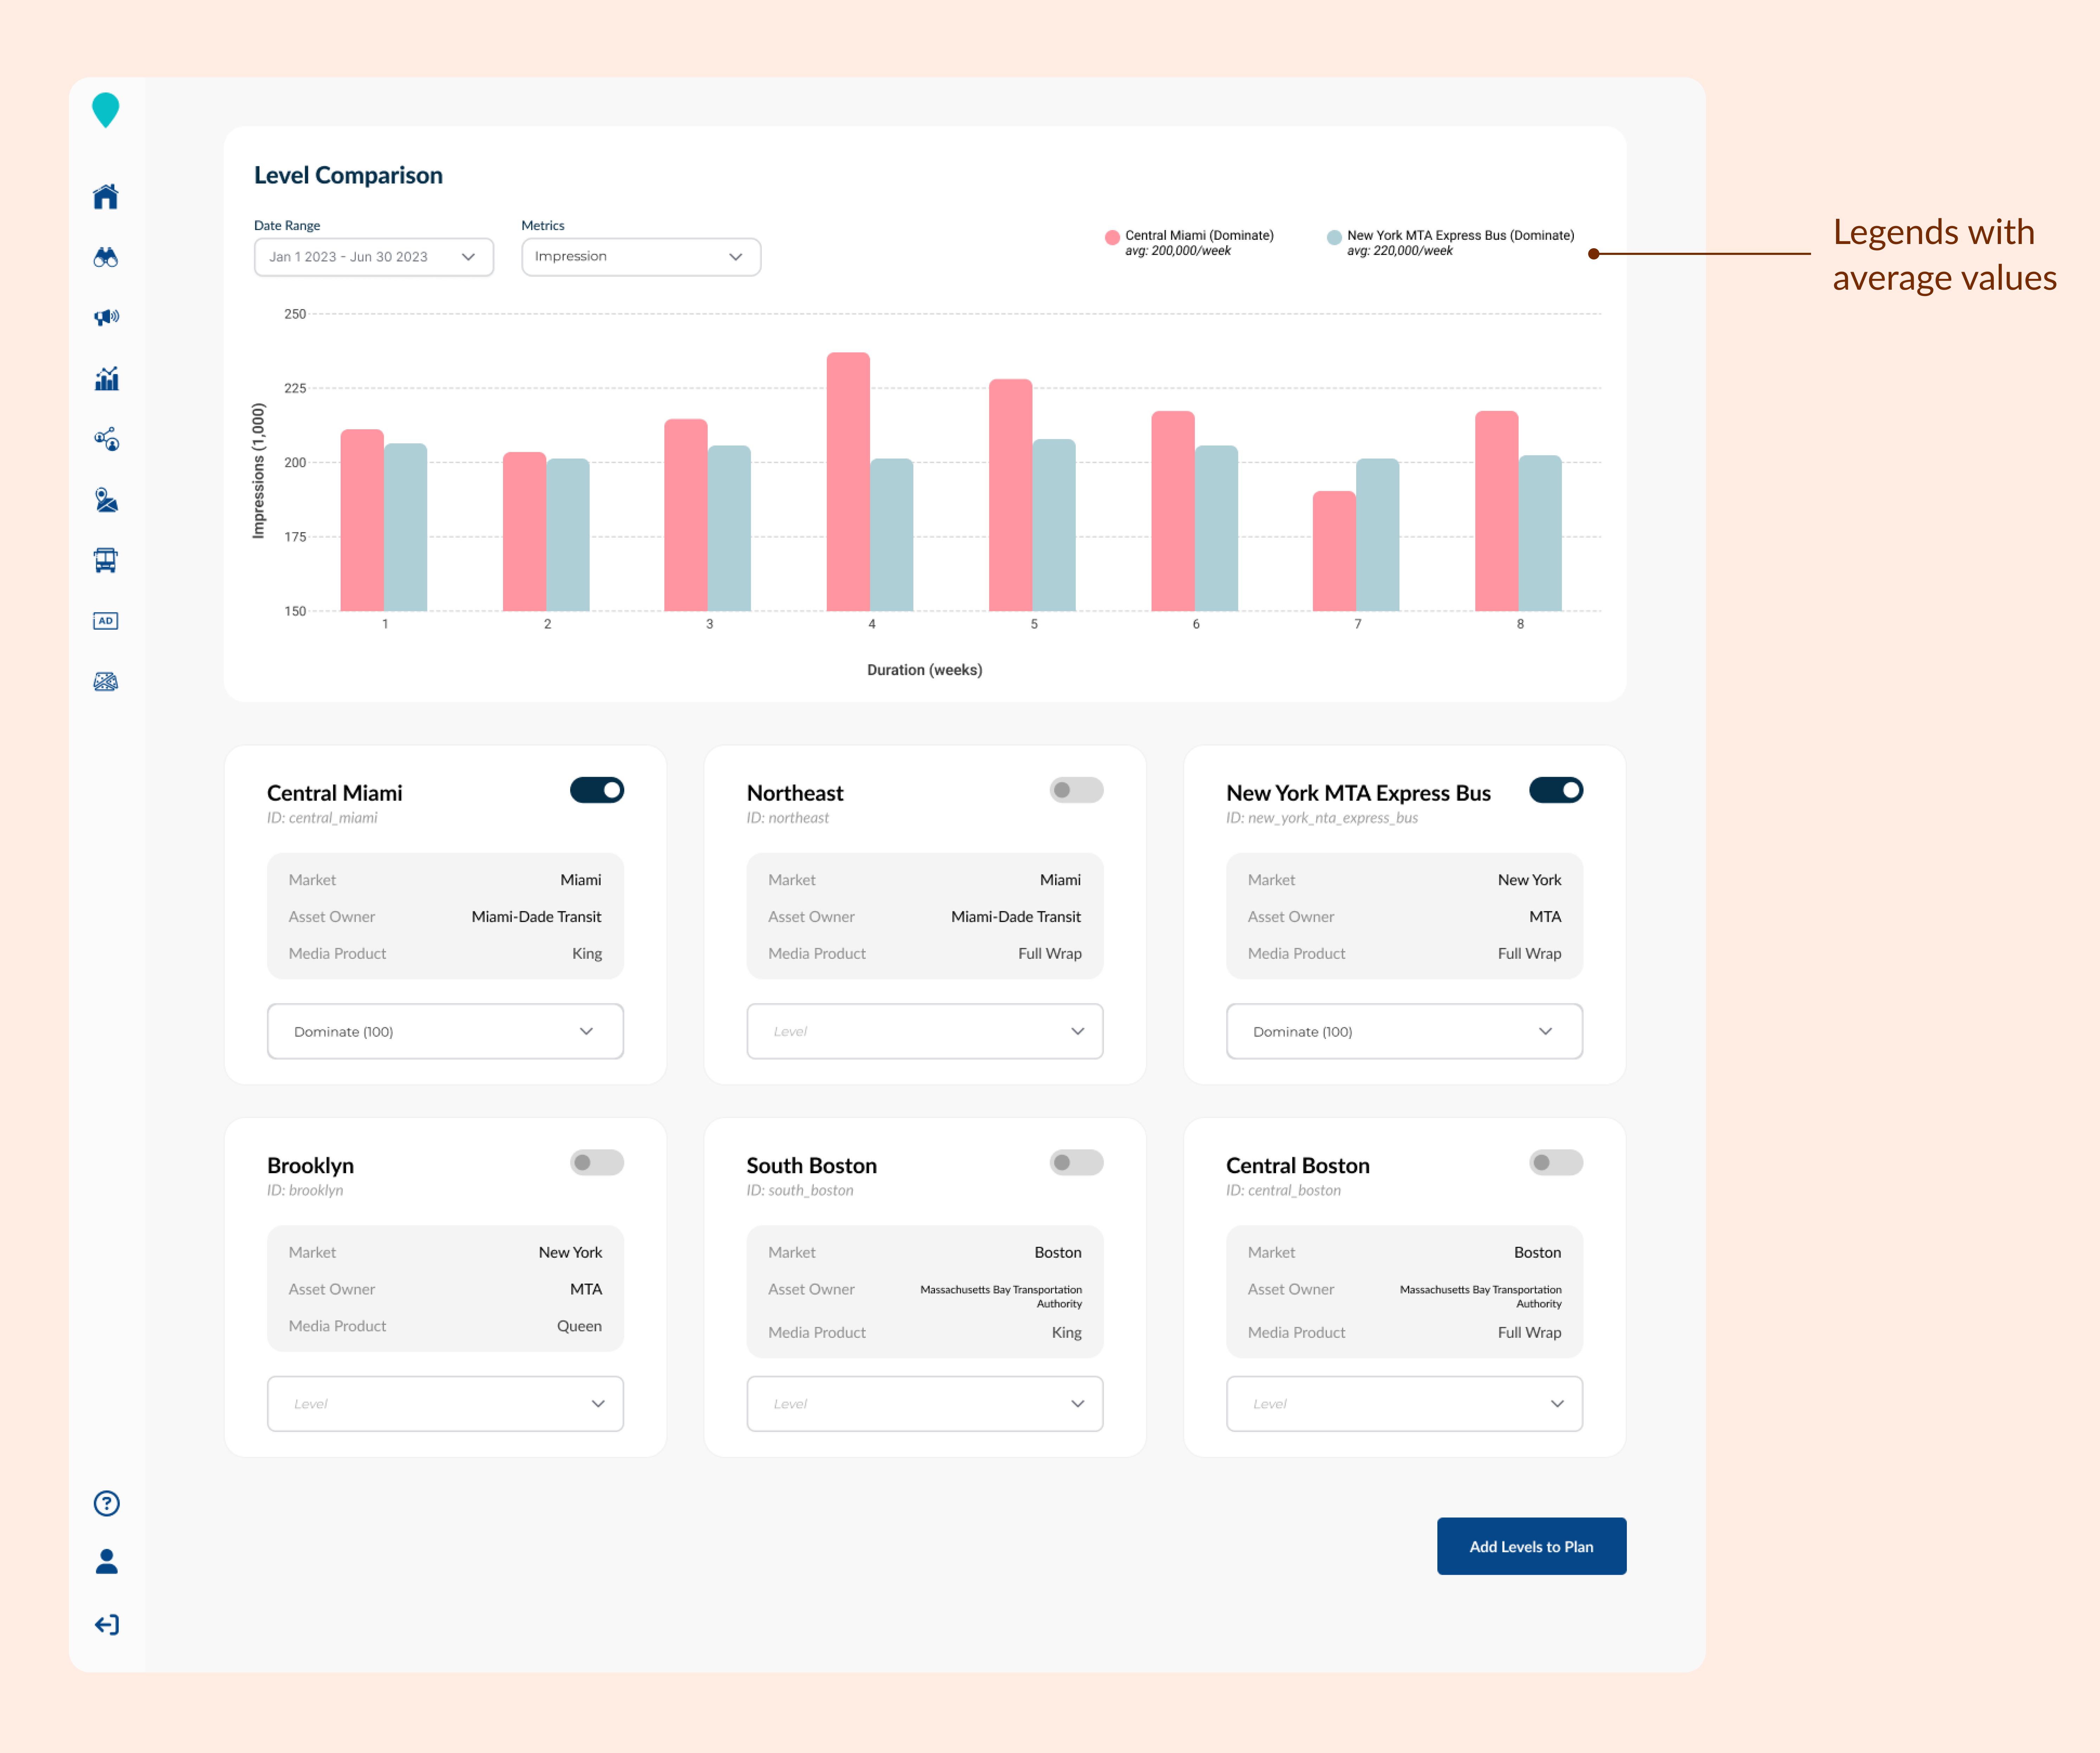
Step 3: Add more markets for comparison purposes by including additional package levels.
Step 3: Add more markets for comparison purposes by including additional package levels.
Step 3: Add more markets for comparison purposes by including additional package levels.
Planner can continue selecting additional packages to review. All toggled-on packages are now included in the media plan being built.
Once packages are activated, they become part of the plan and are ready to be confirmed
Clear legends indicate the the package and level names
Planner can continue selecting additional packages to review. All toggled-on packages are now included in the media plan being built.
Once packages are activated, they become part of the plan and are ready to be confirmed
Clear legends indicate the the package and level names
Design (plan customization)
Design (plan customization)
Step 4: Customization
Step 4: Customization
Step 4: Customization
The planner can perform two actions:
Planner can assign a name and an ID to the newly created plan.
They can also customize the allocation breakdown of the newly created media plan.
Audience details update as allocation breakdown changes
The planner can perform two actions:
Planner can assign a name and an ID to the newly created plan.
They can also customize the allocation breakdown of the newly created media plan.
Audience details update as allocation breakdown changes

Testing
Testing
After Usability Testing, media creation tested well, except for switching between allocation and audience details.
After Usability Testing, media creation tested well, except for switching between allocation and audience details.
After Usability Testing, media creation tested well, except for switching between allocation and audience details.
Usability testing was done through 5 moderated tests with media planners. I found that 4 out of the 5 testers did not realize Audience Details change until updating the allocation breakdown. Otherwise, plan creation tested really well!
Usability testing was done through 5 moderated tests with media planners. I found that 4 out of the 5 testers did not realize Audience Details change until updating the allocation breakdown. Otherwise, plan creation tested really well!

5/5
5/5
Felt confident using this tool without assistance
Felt confident using this tool without assistance
Felt confident using this tool without assistance
5/5
5/5
Had no trouble finding media plans
Had no trouble finding media plans
Had no trouble finding media plans
5/5
5/5
Would prefer using this instead of over the telephone
Would prefer using this instead of over the telephone
Would prefer using this instead of over the telephone
Impact
Impact
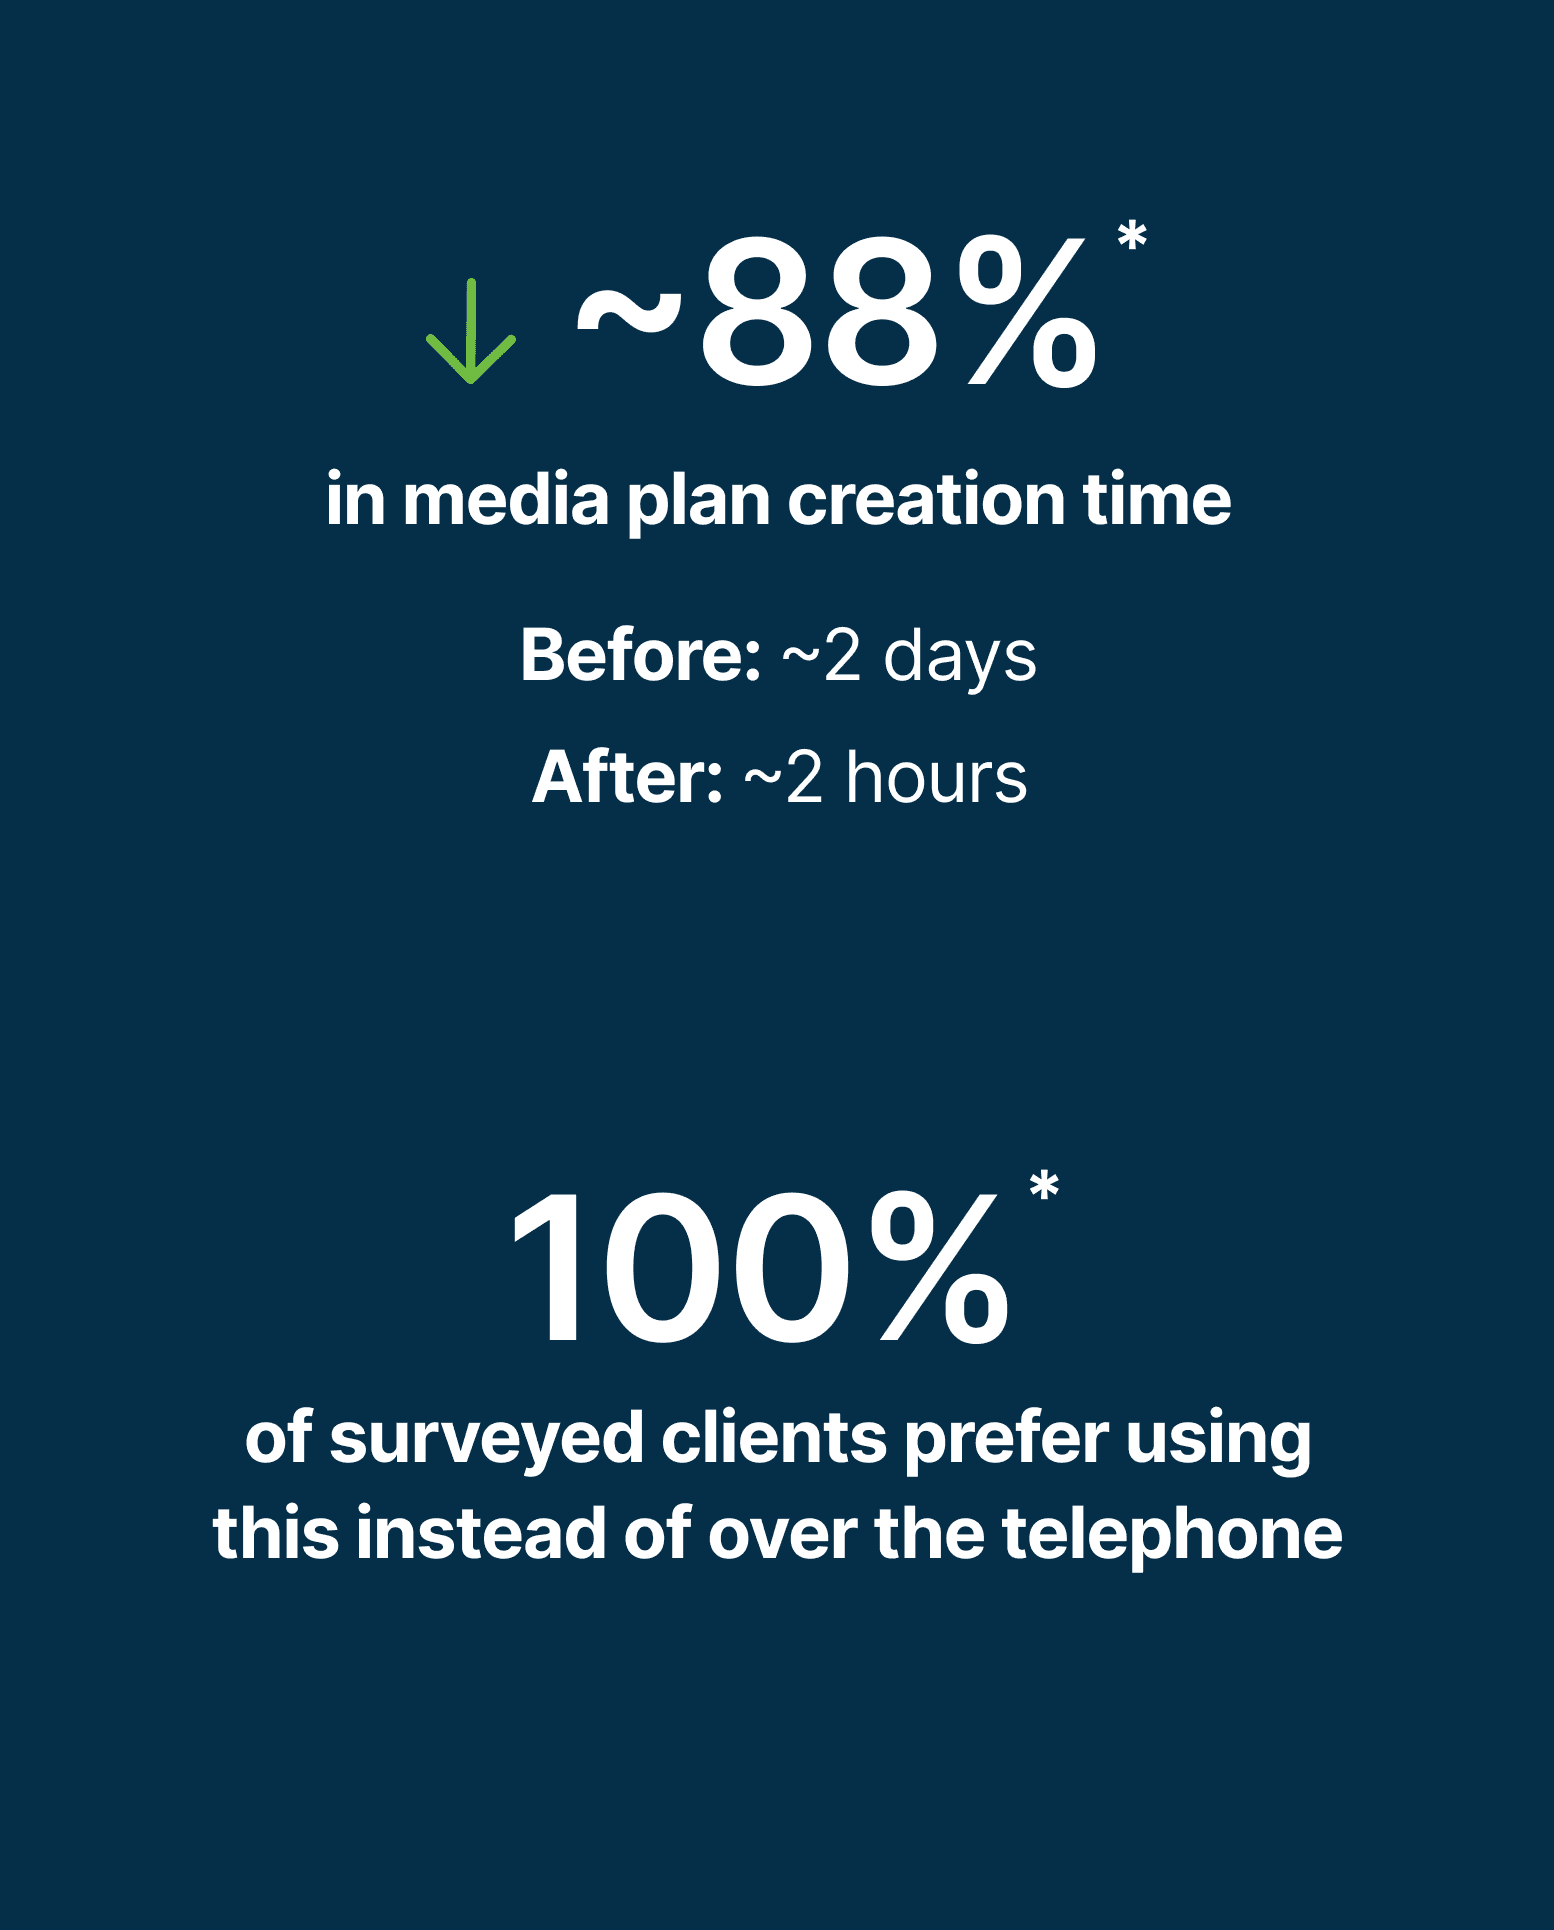
Planners are now 100% self-sufficient in the entire media plan creation process.
Planners are now 100% self-sufficient in the entire media plan creation process.
Planners are now 100% self-sufficient in the entire media plan creation process.
*Based on average client-reported times in a post-launch survey
I handed off the new experience and worked with 2 engineers to get it built. Clients were happy with the simple workflow and internal teams were looking forward to continuing to develop this design.
Post-launch feedback showed that creating a media plan took an average of two hours, compared with roughly two days using the previous email-and-spreadsheet workflow.
The media plan creation self-service eliminated manual back-and-forth with StreetMetrics’ internal teams.
*Based on average client-reported times in a post-launch survey
I handed off the new experience and worked with 2 engineers to get it built. Clients were happy with the simple workflow and internal teams were looking forward to continuing to develop this design.
Post-launch feedback showed that creating a media plan took an average of two hours, compared with roughly two days using the previous email-and-spreadsheet workflow.
The media plan creation self-service eliminated manual back-and-forth with StreetMetrics’ internal teams.
I handed off the new experience and worked with 2 engineers to get it built. Clients were happy with the simple workflow and internal teams were looking forward to continuing to develop this design.
Post-launch feedback showed that creating a media plan took an average of two hours, compared with roughly two days using the previous email-and-spreadsheet workflow.
The media plan creation self-service eliminated manual back-and-forth with StreetMetrics’ internal teams.
*Based on average client-reported times in a post-launch survey

Contact
Contact